Showing posts with label IBMi. Show all posts

Monday, September 26, 2022

Reading my Journal

All,

Ever had a situation where data was being erroneously written, or simply disappeared and you had no idea why.  For anyone with a journaled database on the IBMi this will be an all to familiar issue.  A commitment control boundary may undo your updates, or the data simply doesn't look right as it is being updated elsewhere in your call stack, far away from the code area you are presently maintaining.

When this happens to me I usually like to review the entries in the journal and analyse the database I/O data to get a feel for what is happening.

So how do I go about doing this.....

Firstly I would identify the journal that is being used.  This may change from time to time so it is best to check each and every time you perform these steps.  Do a WRKOBJ for the library and main file you are trying to track entries for.

WRKOBJ OBJ(DATALIB/TARGETFILE)

Take option 8=Display Description and page down three times or do a DSPFD for the given file and search of the Journal name from the output.


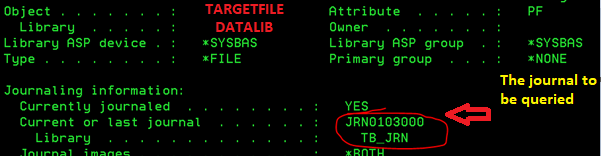
Now you know the journal.  Perform the action(s) you wish to monitor for and note the times.  (start and Finish)

You can then extract this data from the journal using the DSPJRN command.  Below is an example of isolating the entries in a particular environment.  I have gone for all files in library MSLTSTDTA in this example but there are plenty of filtering options.  I then chose to output the resultant data into a file so that I could query it more easily.

DSPJRN JRN(TB_JRN/JRN0103000) FILE((DATALIB/*ALL)) FROMTIME(280222 074200) TOTIME(280222 074300) OUTPUT(*OUTFILE) OUTFILE(LDARE/LD_JOURNAL).  The OUTFILE keyword is optional but will help if you want to perform some queries are a saved dataset.

Please note that the date and time parameters are particularly important as this can take a while to extract otherwise.  Just this small sample took a few seconds interactively.  If querying for more, you might want to consider submitting the task.

The resultant data file is formatted as follows:-


The main item to look for is the 'Entry Type'.  These codes identify when data is inserted, updated or deleted from the database table as well as if it is rolled back.

The table below are the main ones that I refer to.  All of these are for Journal Code 'R' - Operation on Specific Record. For a full list of the items covered by journaling see this link

https://www.ibm.com/docs/en/i/7.2?topic=information-journal-code-descriptions


Entry Code

Description

BR

Before-image of record updated for rollback operation

DR

Record deleted for rollback operation

PT

Record added to a physical file member. If the file is set up to reuse deleted records, then you may receive either a PT or PX journal entry for the change

PX

Record added directly by RRN (relative record number) to a physical file member. If the file is set up to reuse deleted records, then you may receive either a PT or PX journal entry for the change

UB

Before-image of a record that is updated in the physical file member (this entry is present only if IMAGES(*BOTH) is specified on the STRJRNPF command)

UP

After-image of a record that is updated in the physical file member

UR

After-image of a record that is updated for rollback information

 For a full list of journaling codes you can use this link within the IBM i documentation.

 https://www.ibm.com/docs/en/i/7.2?topic=information-all-journal-entries-by-code-type


Saturday, June 1, 2019

Slow running batch tasks - A simple method to get you started

Edit - 27/04/2023 - Tidied up SQL formatting and added a note around multi-member files.

"The EOD job is taking too long!", says every system administrator ever!!!!


Tip: First of all if you are reading this please benchmark the program(s) and do one adjustment each time to determine what is making the difference for your situation.  Don't be tempted into making too many changes at once as you'll never learn the value of each approach.  Overtime you will learn which ones make the most difference for your system workload.  Above all, you must remember to re-baseline after each set of changes, as not all changes are equal, some may actually slow down your programs.
There are numerous strategies for improving overall batch performance.  Typically these would included.

  1. Reducing unnecessary random IO - Use Arrays (or memory) instead of disk IO.
  2. Ensure files are opened and closed once per job execution (if possible).
  3. Try to eliminate multiple passes of the same data set.
  4. Breaking the jobs up to perform threaded processing. Comes with a warning!
  5. Remove journaling overheads (if possible).
  6. Reduce record lock contention.
  7. Place independent jobs in parallel in one subsystem. 
  8. Hardware upgrade (CPU, Disk, Memory) etc.
  9. Distributing processing to after a high intensity window (deferred processing)
This is all well and good but how can you get at the information to assist you with identifying where your programmatic problems are.  Many batch processes can nest into dozens of layers deep (both functions and physical program objects).

Obviously there are tools on the IBMi to assist greatly, some are licensed and others are provided by third parties.  I am going to assume you are reading this and you are not yet ready for performance monitoring or job tracing but just have some general batch performance issues and require some quick wins.

Some developers have the skills to just look at a programs architecture and make some compelling changes but most require some hard evidence.  Even if you are one of these programmers with a great deal of insight for your system I'd suggest you do the baseline below to measure your improvements.

To get started I tend to query the database member statistics pre and post execution for the program(s) to determine what occurred.  Note: It is best to capture this data onsite (production) and slot wrap the following commands around the batch program(s).  If you want to reduce noise (data interference) then end as many jobs and subsystems as relevant so that only the IO of the job at hand is being 
captured.

Please note setup commands and queries are highlighted in pink and queries to analyse the results are highlighted in blue.

Capture before details of file(s) IO

SBMJOB CMD(DSPFD FILE(LIBRARY/*ALL) TYPE(*MBR) OUTPUT(*OUTFILE) FILEATR(*PF) OUTFILE(LEED/BF_DTA)) JOB(BF_DTA) 

Execute the batch tasks/programs in question and then capture the after details of the file(s) IO.

SBMJOB CMD(DSPFD FILE(LIBRARY/*ALL) TYPE(*MBR) OUTPUT(*OUTFILE) FILEATR(*PF) OUTFILE(LEED/AF_DTA)) JOB(AF_DTA)                                       

After this you will have two files that you can compare the before and after scenario.  This can give you  insight into what database activity occurred whilst your program/job (set of jobs) were running.  In the example below the SQL refers to the files as BF_DTA and AF_DTA (both in library LEED).  You will need to change these accordingly.

SELECT T01.MBLIB, T01.MBFILE, T02.MBNRCD, T02.MBOPOP, T02.MBCLOP, T02.MBWROP, T02.MBUPOP, T02.MBDLOP,     
T02.MBLRDS, T02.MBOPOP-T01.MBOPOP AS DIFF_OPEN, T02.MBCLOP-T01.MBCLOP AS DIFF_CLOSE, T02.MBWROP-T01.MBWROP AS DIFF_CRT, T02.MBUPOP-T01.MBUPOP AS DIFF_UPD, T02.MBDLOP-T01.MBDLOP AS DIFF_DLT, T02.MBLRDS-T01.MBLRDS AS DIFF_READ, (T02.MBWROP-T01.MBWROP)+(T02.MBUPOP-T01.MBUPOP)+(T02.MBDLOP-T01.MBDLOP) AS DIFF_CUD, (T02.MBUPOP-T01.MBUPOP)/NULLIF(T01.MBNRCD,0) AS IOINTENSE
FROM LEED/BF_DTA T01 INNER JOIN LEED/AF_DTA T02 ON T01.MBFILE = T02.MBFILE AND T01.MBLIB = T02.MBLIB

Note if you have multi members for a given file then the query above should have the WHERE clause extended by focusing on the main physical file member only.  This helps avoid a many to many join scenario.  In my latest environment I append the following.  You can also tune your query to simply omit certain files also.

AND T01.MBFILE = T01.MBNAME

The output is a comparison by file showing the IO differences i.e. Reads, Updates, Opens, Closes etc.

To output this to a file wrap the SQL statement above with the following...

CREATE TABLE LEED/DIFF AS (
 
INSERT SQL STATEMENT ABOVE HERE!!!
 
) WITH DATA

Again, replace LEED with a library of your choice.

Please note that the target file shouldn't exist already and that a library and file name is your choice and will impact the queries below.

This raw data should be enough for you to highlight any performance bottlenecks.  

Additional Queries

As each environment is different here are a few SQL's to execute over the differences file to provide some pointers.


The queries below will help to identify certain database performance scenarios.  I have highlighted the recommended editable values.

High IO Count

SELECT MBLIB, MBFILE, DIFF_CUD FROM LEED/DIFF WHERE diff_cud > 100 ORDER BY diff_cud desc     

Review and see if the IO is commensurate with the number of accounts or clients (records)  being processed etc.  if not, you may have duplication and refactoring could help.

High IO and Triggers

SELECT t01.MBLIB, t01.mBFILE, DIFF_upd FROM LEED/DIFF t01 inner join ytrgctlp t02 on T01.MBFILE = T02.TRGFIL WHERE diff_upd > 100 AND T02.TRGEVT = 'U' and T02.CMTLVL = 1 ORDER BY diff_upd desc       

This will highlight any files with high IO that also have Synon triggers.  Excessive volume may lead to increases in runtime.  Perhaps you have changed objects that are updating records which haven't changed....  Null Update suppression may work here. 

Excessive Reads (Arrays, *QUIT required, Join Logicals)

SELECT MBLIB, MBFILE, DIFF_read, MBNRCD FROM LEED/DIFF WHERE diff_read > 1000 ORDER BY diff_read desc                     

The 1000 (example) figure is very low.   Typically I would be looking for numbers in the millions for a good sized client. 

Excessive Reads for low record count files (Possibility to move to arrays)

SELECT MBLIB, MBFILE, DIFF_read, MBNRCD FROM LEED/DIFF WHERE diff_read > 1000 and mbnrcd < 100 ORDER BY diff_read desc  

Again, review these numbers based on the client database. If you are constantly reading from the same file then these could be committed to memory (array), moved to SSD, loaded in memory etc.

High UPDATES for low volume files (indicates potential contention i.e. a surrogate etc)

SELECT MBLIB, MBFILE, DIFF_upd, MBNRCD FROM LEED/DIFF WHERE diff_upd > 1000 and mbnrcd < 100 ORDER BY diff_upd  desc  

Note: Often people have a surrogate file to get next value for a key.  Especially if you are running parallel processing (either multiple jobs or parallel jobs over one dataset) the parallel jobs can cause record lock contention.

High File Open/Close

SELECT MBLIB, MBFILE, DIFF_open FROM LEED/DIFF WHERE diff_open > 10 ORDER BY diff_open desc     
          
This is used to identify if the task/program has excessive close downs.  Perhaps a routine is set to Closedown = 'Y'.  It is inefficient to keep opening and closing files.  Check the Synon function options within your call stack.

I hope that this information is useful and motivates you to finally have the confidence to look at that long running job.  Using some of these techniques above I have had significant performance improvements.  It is the true IO data that is a reflection of your code and for that you need to use tools or mine the data for yourself.

This, I promise, is a good starting point and as always, I'm happy to help.

Thanks for reading.
Lee.